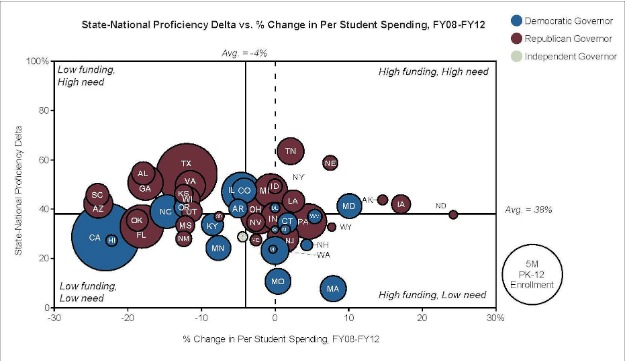
If the chart above appears only to be a mess of undecipherable bubbles, look more closely. The man who prepared it, Robert Lytle, a head of Parthenon Group’s Education Center of Excellence, sees a business opportunity.
I’ll explain. The chart shows all 50 states plotted based on two factors: the state’s change in per-student education spending, and the difference between how many students scored “proficient” on state tests vs. national tests. The size of each bubble is based on population. A state like California, a populous state that is slashing its education budget but rates its students relatively in line with the National Assessment of Educational Progress tests, goes in the bottom left. A state like Tennessee, where education spending increased between 2008 and 2012 but state test scores wildly overrate students compared with NAEP, goes in the upper right.
It’s in the states in the upper right that the best business opportunity—for both for-profit and non-profit investors, publishers