
Photo by Bash Fish on Unsplash
Did you know there’s a technical signal that can alert you to a dramatic change in the markets? If you’re a Forex trader you really need to know about this signal. It’s called “head and shoulders,” and you can use it to better forecast the markets and improve the success of your trades.
RELATED ARTICLE: WHY DOES TECHNICAL ANALYSIS WORK?
What Causes a Change in the Markets?
If you’ve been trading Forex for a while, then you know that a change in the market in either direction represents an opportunity for you. If you’re smart about it, you have learned to stay alert for such changes, and you use a variety of technical signals to do so. In this post, we take a look at one of those signals, called head and shoulders.
Generally speaking, the markets change direction when governments make changes to their monetary policies. More rarely, changes in the markets happen when an unexpected world event happens. For example, this might be a sudden outbreak of violence in a sensitive area of the world, or it might be the onset of a pandemic.
How Can This Signal Help a Trader Remain Vigilant?
The head and shoulders signal can be a valuable tool when you’re trying to stay on top of a rapidly changing market.
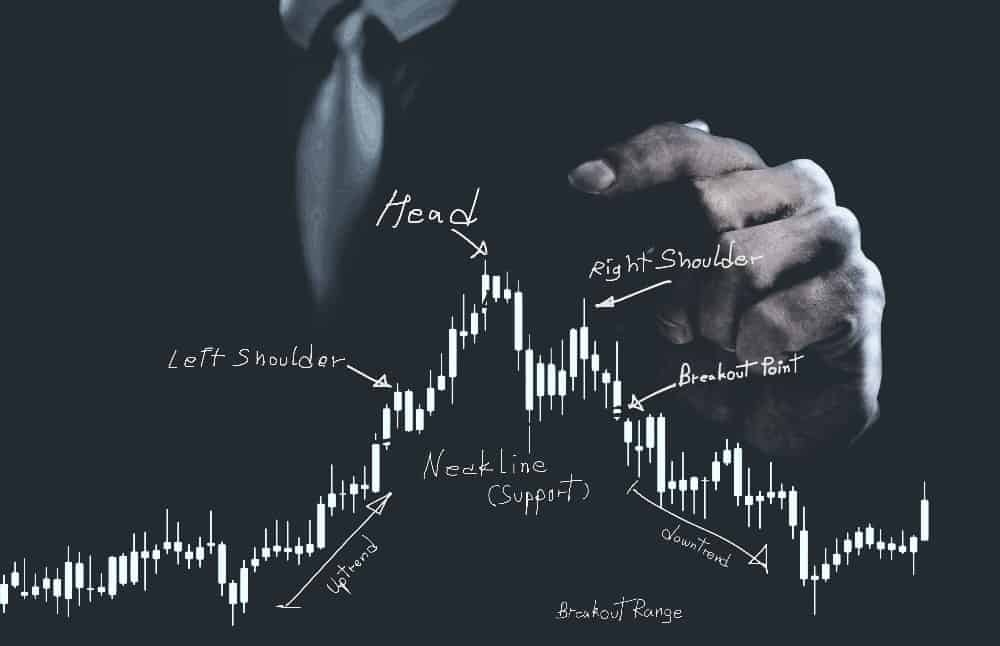
For example, if you see a head and shoulders signal such as the one shown here, you can predict with a good deal of confidence that the market is headed for a bearish reversal. In other words, the trend has been moving in an upward direction, but it is about to reverse course. This might mean a short-term change, or it could mean a long-term change.
An Inverse Head and Shoulders Signal Means the Opposite
On the other hand, if you see a signal that looks like the reverse of the one above, as shown below, it means that the market is likely headed for a bullish reversal. This pattern is called an inverse head and shoulders signal.
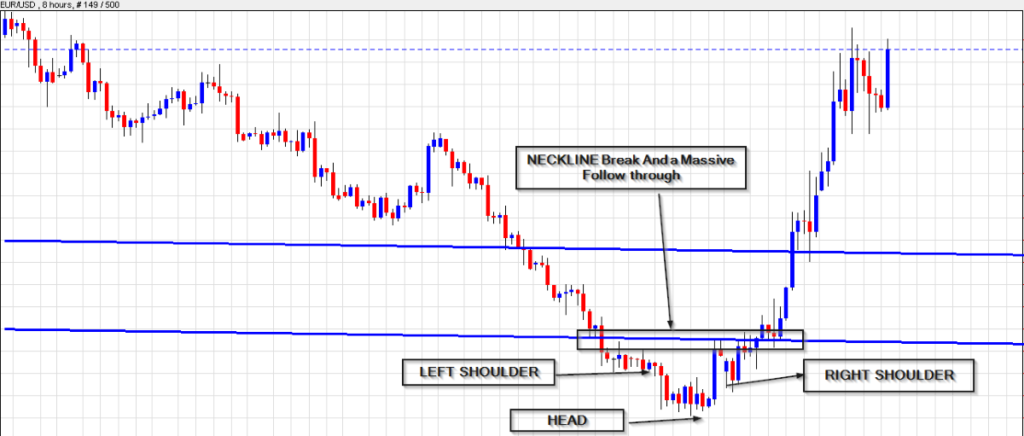
An inverse head and shoulders signal always forms at the bottom of the chart, while the standard head and shoulders signal forms at the top. Both patterns signal a dramatic shift in pricing.
Characteristics of Head and Shoulders Patterns
When a reversal is taking place, prices tend to correct in the opposite direction for a short time. This leads to a zig-zag pattern that is easily recognizable if you know what to look for. For example, the head and shoulders pattern has three visual characteristics that you can learn to recognize:
- When the price is trending higher, the signal forms a peak. Then it declines to where it was before. This forms the left shoulder of the pattern.
- Next, the price surges up again. Here, it becomes more elevated than before and forms a new, higher peak. Then it falls back to its previous base, forming the head.
- The price goes up yet again. However, this time it only comes up to roughly the same level as the left shoulder. Finally, the price reverses again and falls back to the level of the base support. This forms the right shoulder.
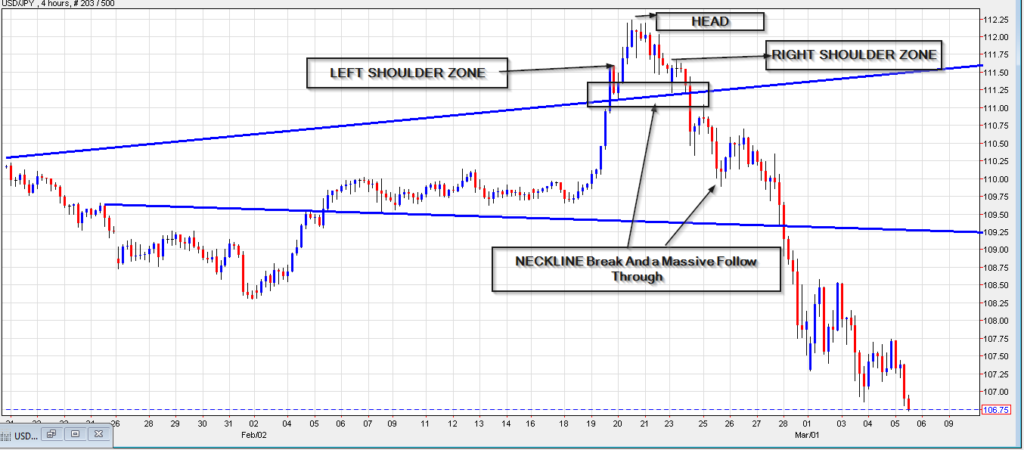
Experienced Forex traders refer to the base support of the shoulders as the neckline. When a bearish break occurs after the right shoulder shows up, this is called a neckline break.
How to Trade the Head and Shoulders Pattern
You can choose to trade this pattern either conservatively or aggressively. If you’re a conservative trader, you will probably wait for confirmation that you have seen a neckline break. Then you would open a trade in the same direction as that break.
On the other hand, if you want to address your trade aggressively, you might get into a trade while you believe the neckline break is occurring. However, this can be risky. This is because you might be misreading the charts, and a neckline break might not be occurring at all.
To be clear, a neckline break will only happen if prices are moving in a bearish direction just after the completion of the right shoulder. In other words, this will only happen in the case of a standard head and shoulders pattern.