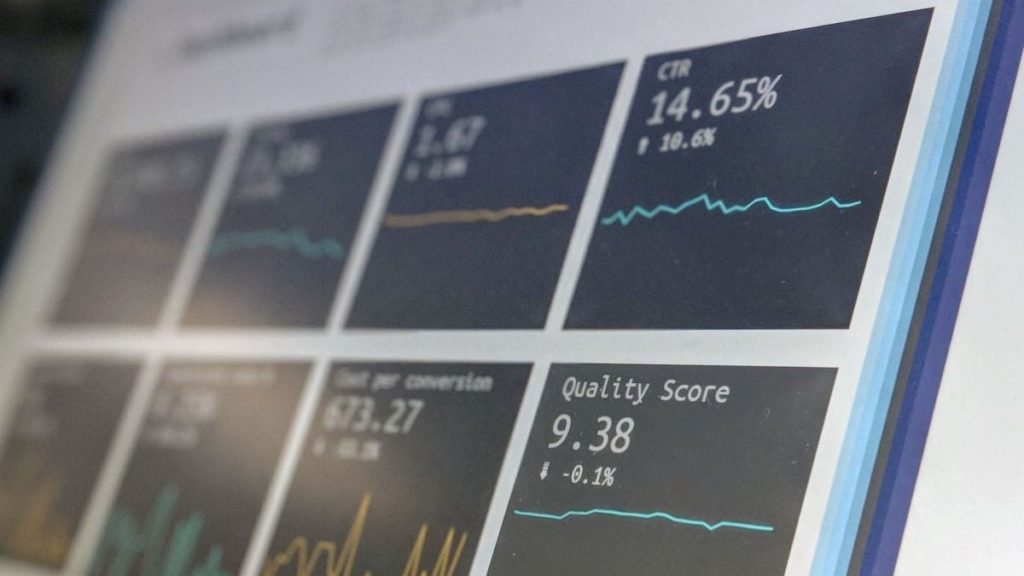
Photo by Stephen Dawson on Unsplash
Online trading of the capital markets requires some understanding of risk management, leverage, and the ways you can use charts to perform technical analysis.
It’s important to understand how to use the tools your broker offers to evaluate new information. This can drive the price of the assets that you plan to trade. Here is some information on how to use some techniques that will allow you to more efficiently conduct your online trading.
RELATED ARTICLE: TOP 4 2020 INVESTMENT OPPORTUNITIES FOR YOUR BUSINESS
Using an Economic Calendar for Online Trading
What is important to understand about the capital markets is that the price of a security depends on all the available information. When new information becomes available, traders buy and sell securities to reflect the new information.
Therefore, one of the best ways to keep track of pertinent new data when you are trading online is through an economic calendar.
This is because an economic calendar tells you the important information that will be released for each country. Then you can sort the calendar by the countries you are following for your online trading.
Advance Knowledge About New Data
Generally, an economic calendar will show you the new data that is scheduled to be released, along with an estimate of what economists forecast for each data point. For example, you might see that an employment report is about to come out, along with an estimate of what the report will show.
In addition, you might also see the prior month’s release of that same economic data. What most traders do is compare the actual release to the forecasted release. This is because the forecasted release was likely priced into tradeable securities. Accordingly, the new data will help reprice that data for their online trading.
Utilizing Technical Analysis in Online Trading
Once the information becomes available, you might see a change in the prices of securities. Then these changes can be measured on a chart and evaluated using technical analysis.
Technical analysis is the study of past price movements. Therefore, you can measure these movements using a historical chart or graph to gain a better understanding for your online trading. This might include finding support and resistance levels using a trend line or a moving average.
Additionally, you might use studies that measure trend movement or momentum. There are also technical analysis studies that tell you if a security is overbought or oversold. All of these measurements will help you with your online trading.
Risk Management and Leverage in Online Trading
A chart and technical analysis can help you with risk management in your online trading. This is a key component of any online trading strategy.
For example, prior to making an online trade, you want to have an idea of exactly where you will enter or exit a trade. This is part of your risk management strategy. You want to have a clear idea of where you plan to exit the market with a profit or a stop loss.
To do this, you need to develop a risk management strategy. Your exit criteria could be based on a dollar figure or on a percent change in the price. You might even base it on critical chart levels that you can pick out using technical analysis.
Your risk management strategy for your online trading should also incorporate the leverage you plan to use when you trade. Leverage is the amount of capital you can use to increase the value of your individual trades.
You use leverage in conjunction with a margin account. This is an account that allows you to use your broker’s capital to enhance the size of the positions you trade.
The leverage you can employ depends on the securities you are trading. For example, Forex trades might provide leverage up to 50-1, where cryptocurrency might be 10-1.
Key Takeaway
The bottom line is that you should spend some time learning to understand the tools that are available to help you with trading the capital markets online. This includes how to use an economic calendar, how to use charts and technical analysis, and a basic knowledge of leverage.
