
The Keltner Channel one of several technical indicators that Forex traders rely on. Used in conjunction with other indicators, it can help you to improve your Forex trading.
What Is the Keltner Channel?
Various technical indicators that Forex traders use inform them about the current trends and volatility level of the market. The Keltner Channel is one of these indicators. Devised in the 1960’s by Chester W. Keltner, this indicator is one of several that rely on the use of bands.
RELATED ARTICLE: IMPROVE YOUR FOREX TECHNICAL ANALYSIS SKILLS
Bands in technical indicators have an upper level and a lower level. Traders can learn a great deal from the information between these two levels, or the band. Some common examples of technical indicators that use bands are Bollinger Bands, Envelopes, and Donchian Channels. There are others, as well.
Technical indicators that use bands can help a trader more easily spot levels that have been overbought or oversold, among other factors.
The Keltner Channel Is Unique
If you’re going to rely on technical indicators to help you with your Forex trades—and you should—it’s best to understand how they work.
The Keltner Channel calculates volatility by taking into account the average true range indicator. You could do these calculations manually, but today’s indicators do them for you automatically.
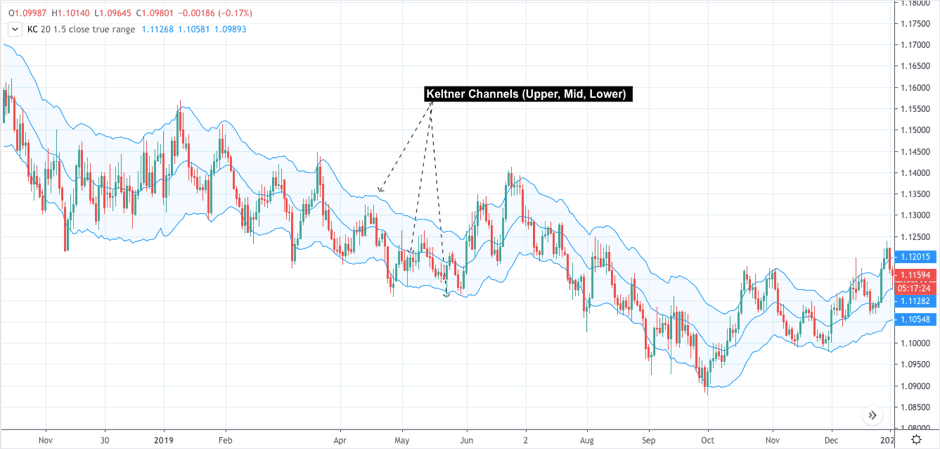
As shown in the illustration above, the Keltner Channel has three lines. There is the upper channel line, the bottom channel line, and the midline.
If you want to do the calculations manually, take the midline value and multiply it by 1.5. Then add that number to the midline value to ascertain the value of the upper line at that point.
Similarly, subtract that number from the midline value to determine the value of the lower line. You can experiment with these values to make this indicator more or less sensitive to price and volatility.
You can set the Keltner Channel to use a 10-period or a 20-period setting. Then it measures an exponential moving average to form the basis for the typical price.
Because it uses volatility as a basis, the Keltner Channel tends to expand or contract slightly. And because it does, traders can detect volatility in the price action of whatever security they happen to be observing.
It’s Still Useful After All These Years
Despite its age, the Keltner channel is still quite popular among successful traders. However, they most often use it along with other indicators.
For example, some traders like to use the Bollinger Band Squeeze and the Keltner Channel together. This method works because when volatility contracts in the market, both the Keltner Channel and the Bollinger Bands simultaneously indicate this phenomenon.
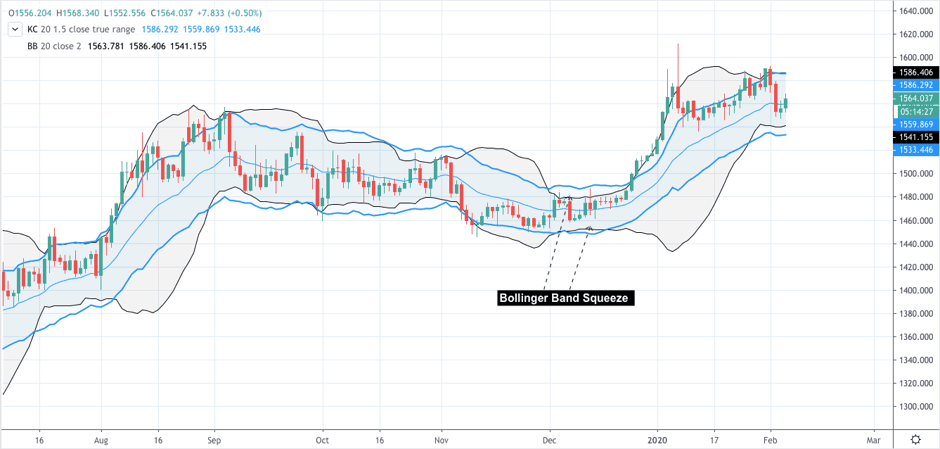
The chart above gives an example of a Bollinger Band Squeeze within the Keltner Channel.
Traders Use the Keltner Channel in Various Ways
If a trend is running strong, the price of a security price tends to trade consistently above or below the bottom channel line. Eventually, though, prices will line back up with the mid-line.
Let’s say a trader begins to notice that the price is staying within the bands but is closing in on either the upper or the lower band. This lets the trader know, just by looking at the Keltner Channel, that levels are either being oversold or overbought.
What Is Spread Betting?
On a side note, you might have run across the term “spread betting” as you looked into ways of using the Keltner Channel. So, what is spread betting and how does it differ from Forex trading? To learn more, read the article here.
Conclusion
Sometimes, the bands in the Keltner Channel will begin to compress together. This is an indication of extremely low volatility. However, low volatility generally leads to a quick transition into higher volatility.
When this happens, experienced traders know to be poised for breakout trades. Then, depending on the slope of the bands and the channels, they will choose to take either long or short positions.